Acoustic
Analyzer
A perception-first analysis plugin that goes beyond raw frequency readouts. It models how the ear hears (24 Bark bands, loudness, sharpness and roughness) and combines brightness, harshness, dynamic variability and temporal unpredictability into an Acoustic Activation Index (0–100, high = calming). You can record sessions, rate how calming the sound feels, and export the data for research. The audio passes through unchanged.
Experimental research tool. Not a medical or clinical device, and not a substitute for listening tests. See accuracy & limits.
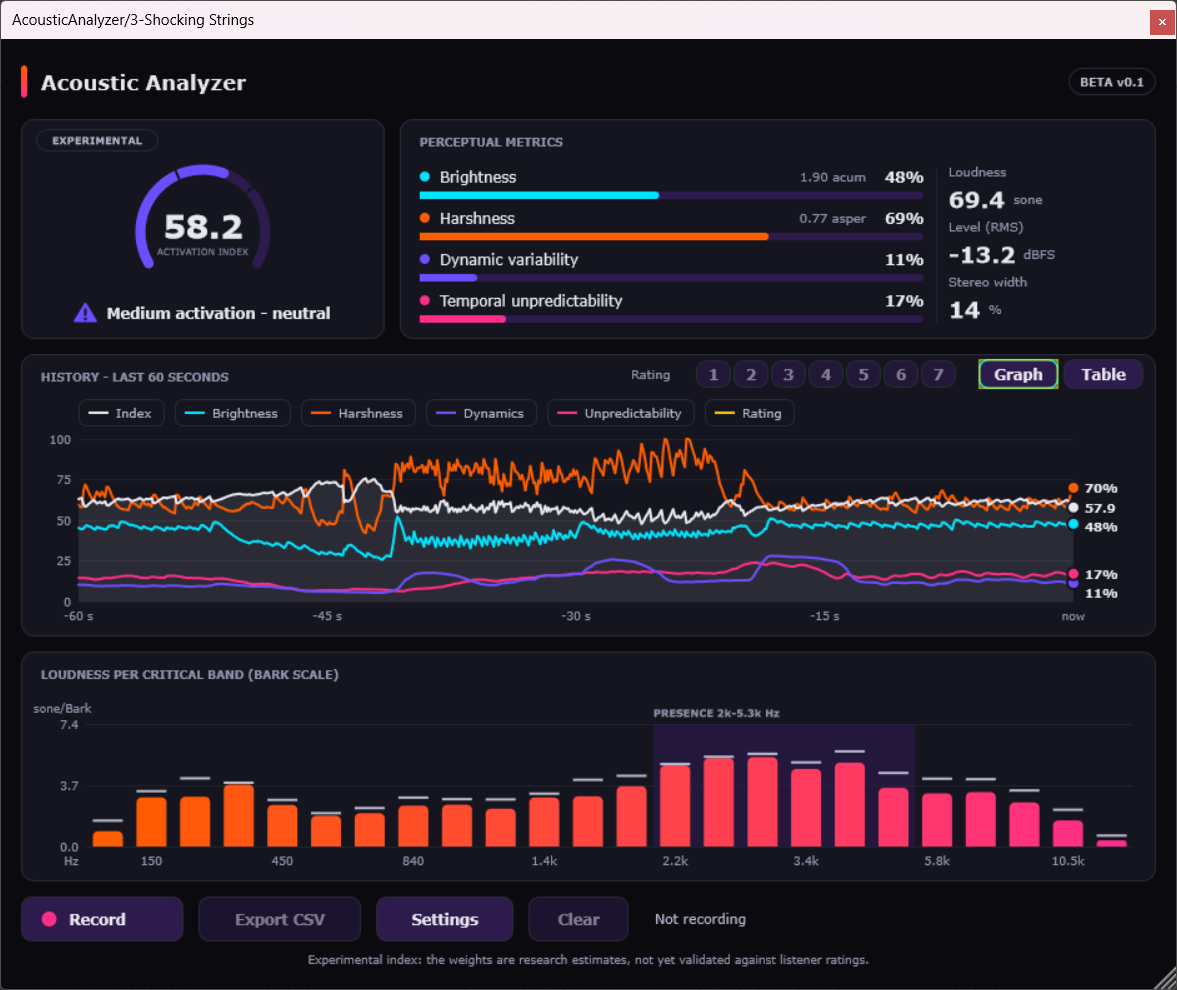
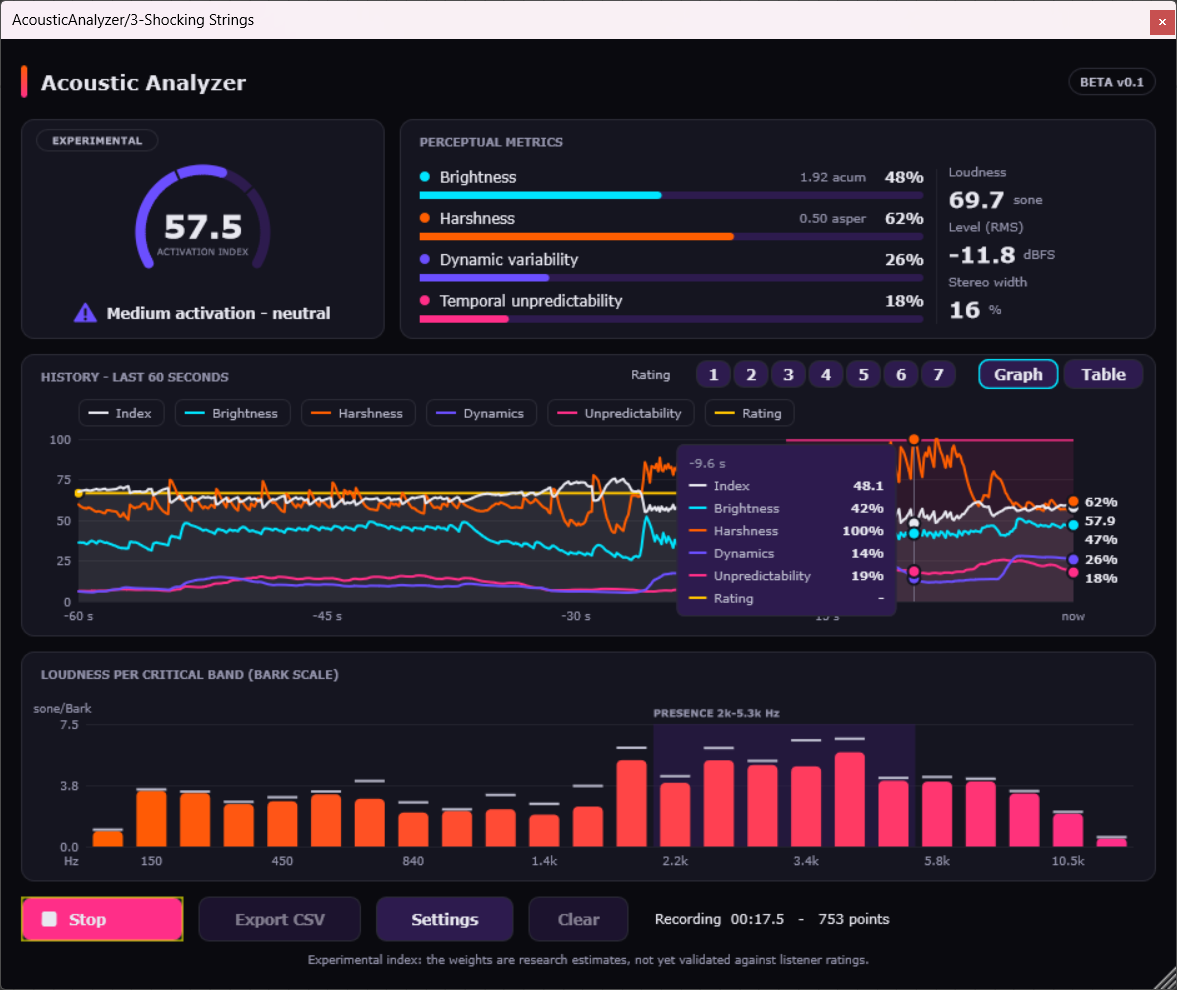
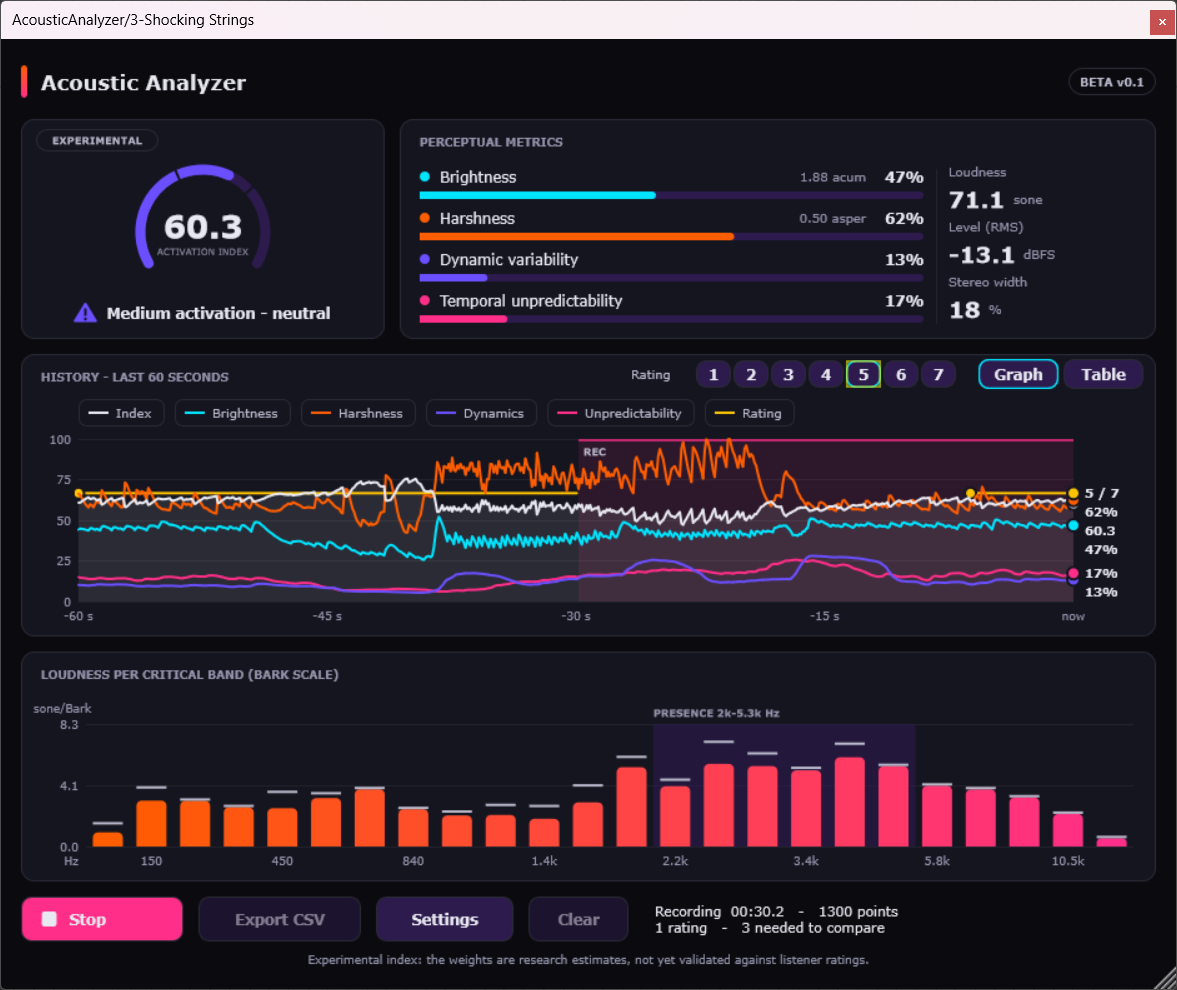
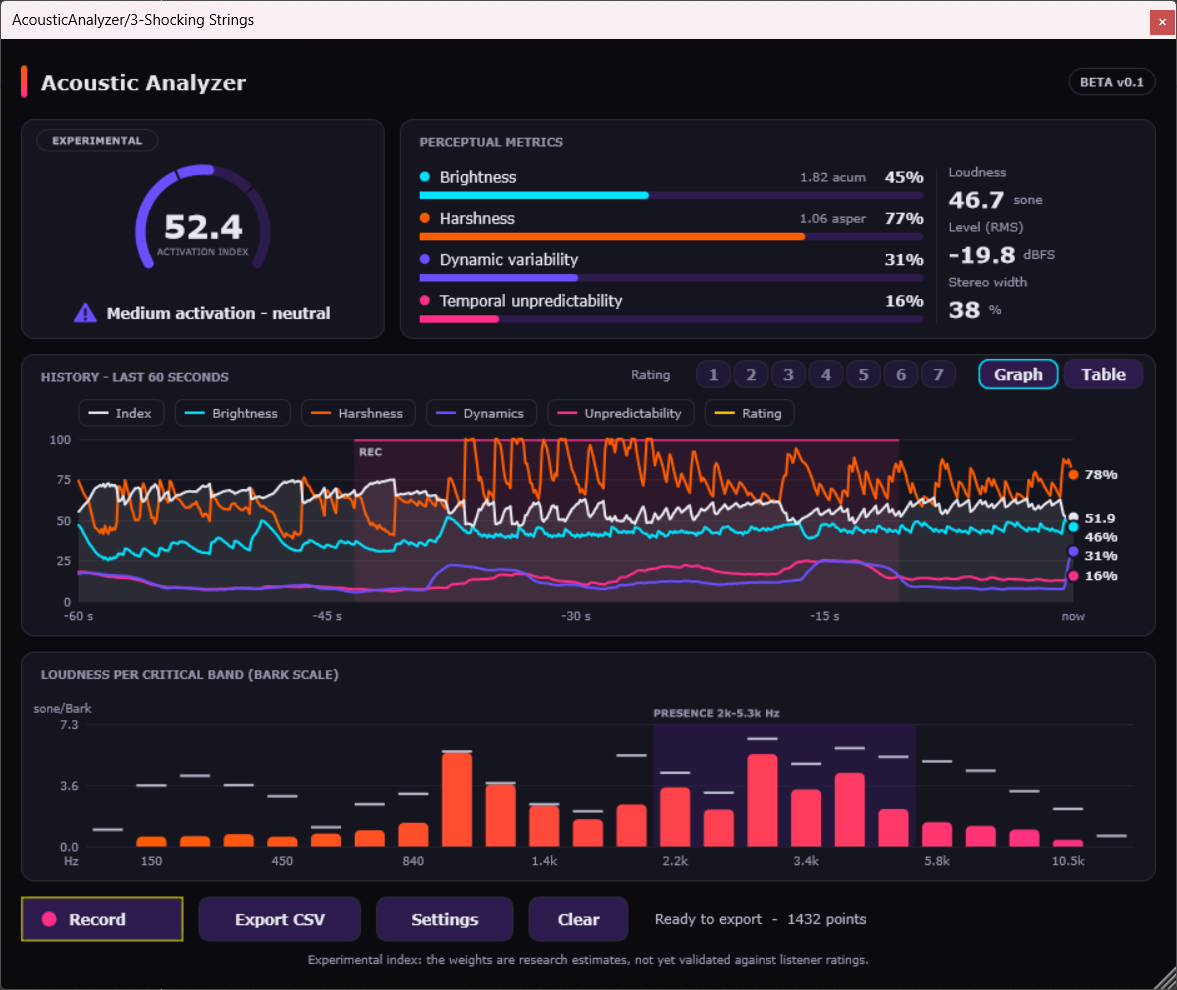
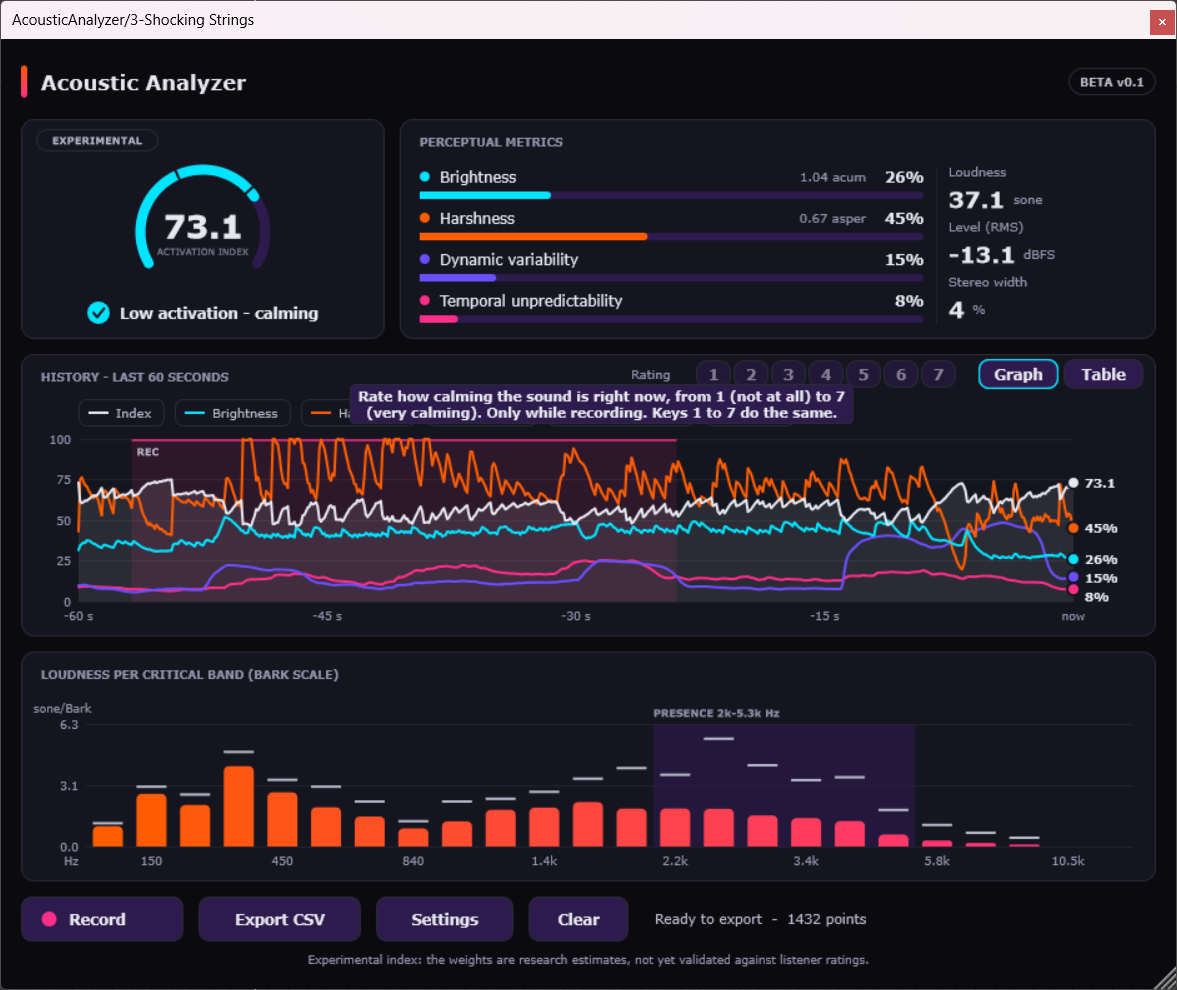
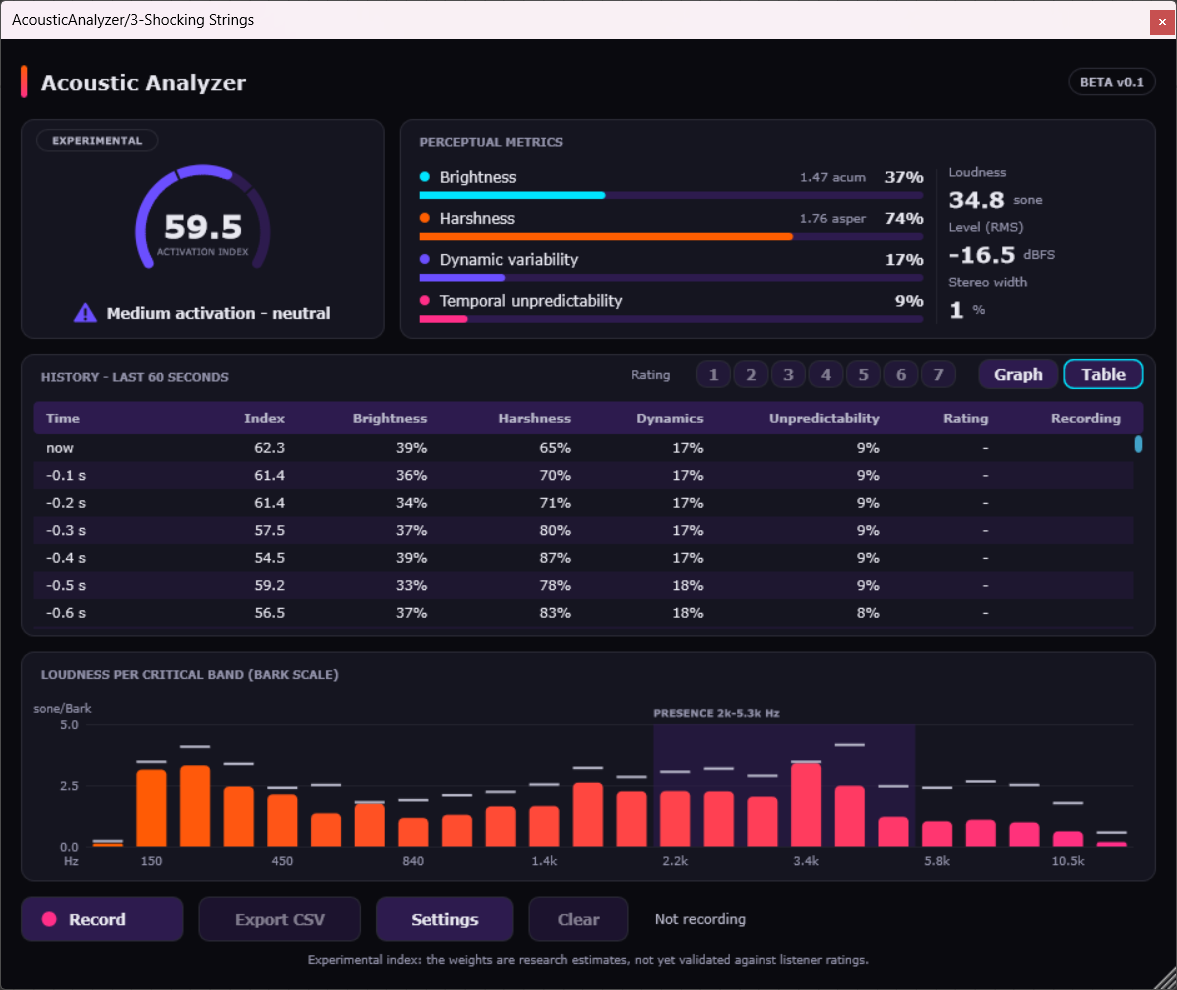
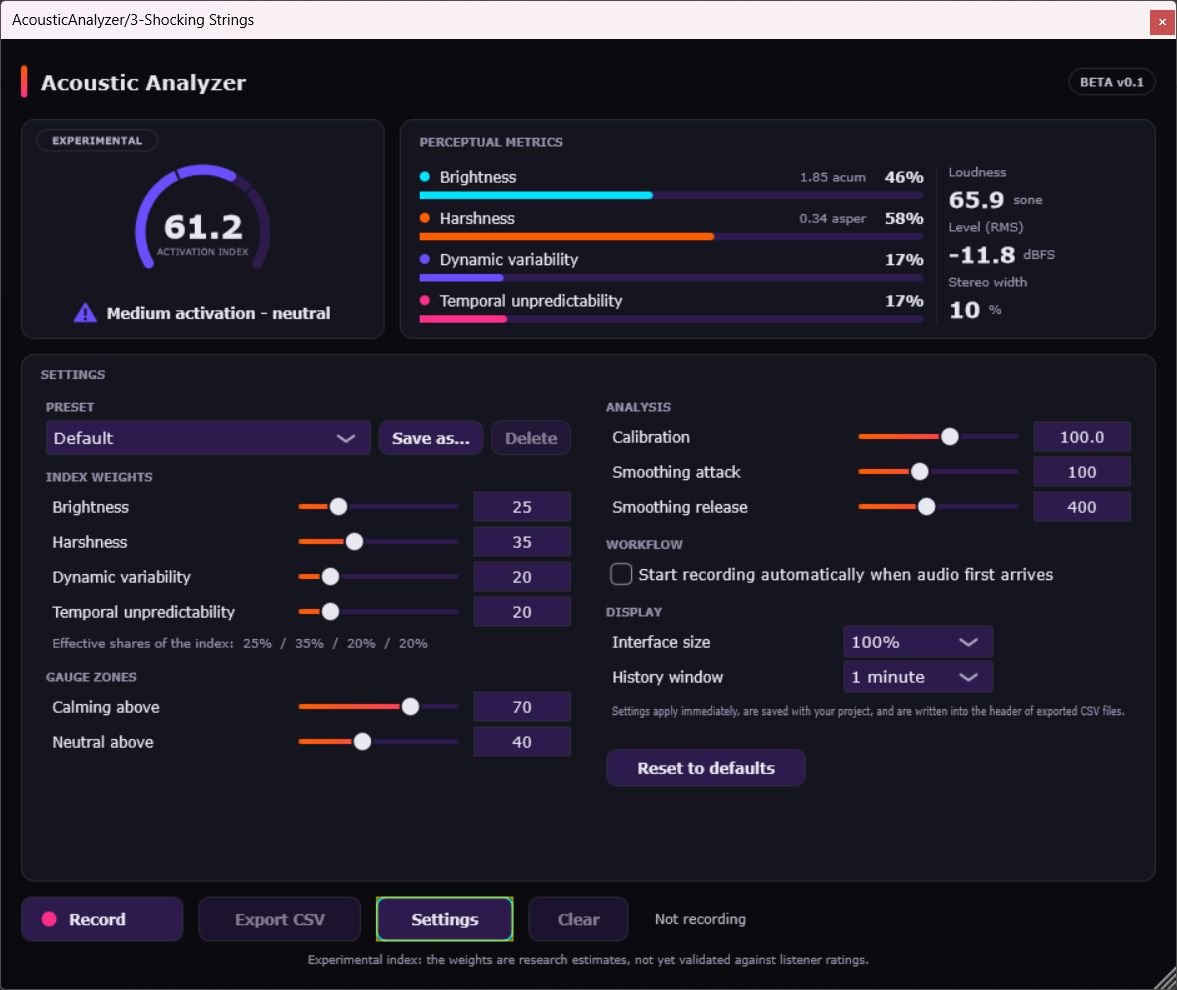
Analysis Metrics
- Brightness: sharpness in acum (von Bismarck / Zwicker), computed from specific loudness on 24 Bark bands
- Harshness: roughness (simplified Daniel & Weber) combined with loudness in the 2–5.3 kHz presence region
- Dynamic Variability: spread of 50 ms RMS levels over the last 5 seconds
- Temporal Unpredictability: size of the jumps between successive 50 ms levels
- Also shown, not in the index: loudness (sone), RMS level (dBFS) and stereo width
Research & Export
Recording and ratings
Start and stop a session with timestamped frames, logged through a lock-free buffer so recording never touches the audio thread. Press 1–7 to rate how calming the sound feels right now.
CSV, JSON and label-track export
Exports carry the settings and calibration in a metadata header, all component metrics, the index and your ratings. CSV and JSON load straight into R, Python or Excel; an Audacity label track marks each rating on the waveform.
Analysis script
A Python script reports how each metric correlates with the ratings and suggests weights with bootstrap intervals. It refuses to fit with fewer than 10 ratings.
Four perceptual dimensions combine into a single 0–100 score. High = calming: 70 and above reads Calm (cyan), 40–69 Neutral (violet), below 40 Stimulating (pink), each with its own icon and label. The weights below are adjustable starting values, not coefficients fitted to listener data.
Roughness plus presence-region loudness. Given the largest starting weight because harsh sound is the most common cause of listener discomfort.
Sharpness of the spectrum. Brighter sounds pull the index toward stimulating.
How much the level moves over the last five seconds. A steadier signal scores as calmer.
How abrupt the level changes are. Sudden jumps pull the index toward stimulating, whatever the overall loudness.
The three underlying measures were checked against MoSQITo 1.2.1 (ISO 532-1 loudness, DIN 45692 sharpness, Daniel & Weber roughness) on 57 calibrated test signals at 48 kHz. Rank correlation shows how well the plugin orders sounds the same way the reference does.
⚠️ What this is not
Acoustic Analyzer is an experimental research tool, not a medical or clinical device, and it does not measure the brain. The Activation Index has not yet been validated against listener outcomes; only the underlying measures have been checked against reference software. The plugin ranks sounds well but absolute values are approximate: loudness reads about 1.5–2× high on broadband noise, and roughness about 3× high on broadband noise modulated at 70 Hz. Validation used synthetic signals only, and the model assumes 100 dB SPL at 0 dBFS unless you change the calibration setting.
Beta builds are coming soon. The Windows build will be unsigned, so Windows SmartScreen may show a warning. The macOS builds will be signed and notarised. Contact for early access or research partnerships.
🔬 Planned Work
Testing with real music and game audio, a listening study to check whether the index tracks how people actually feel, reducing the broadband-noise bias in loudness and roughness, and signed Windows and macOS beta builds.
Interested in Collaboration?
Open to beta testers, listening-study partners, and research partnerships involving acoustic perception measurement.